
Will Holker, a student of computer science, was having a difficult time creating the UML diagrams as part of his assignments. He wasn’t entirely well-versed with UML and how it works. After multiple attempts, he even considered seeking UML assignment help from online academic services.
Like Will, many of you probably don’t have a complete understanding of what UML Diagrams are and what their purpose is. The UML diagrams are divided into two broad categories which are- structural diagrams and behavioral diagrams. As the name clearly suggests, some UML diagrams try to assess and depict the structure of a system or process, whereas others describe the behavior of the system. Let’s delve deeper.
Structural UML diagrams
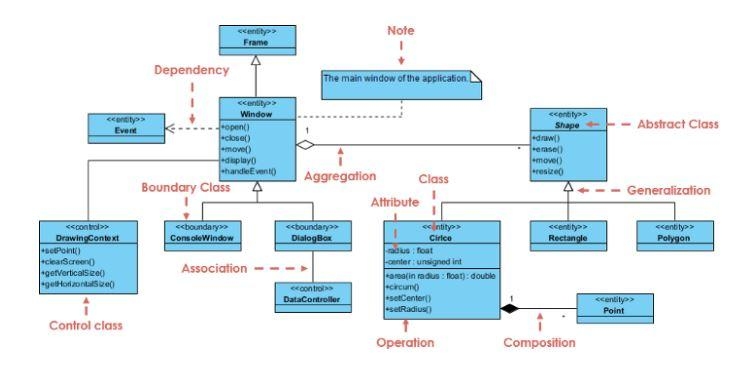
1. Class diagram
Class diagrams are the primary component of any object-oriented solution. It highlights the classes in a system and the relationship between each class.
In the case of most modeling tools, a class comes with three sections- the name comes at the top, attributes in the middle, and operations or methods at the bottom. In a large system with many connected classes, they are grouped together to create class diagrams. Different connections between classes are indicated by different types of arrows.
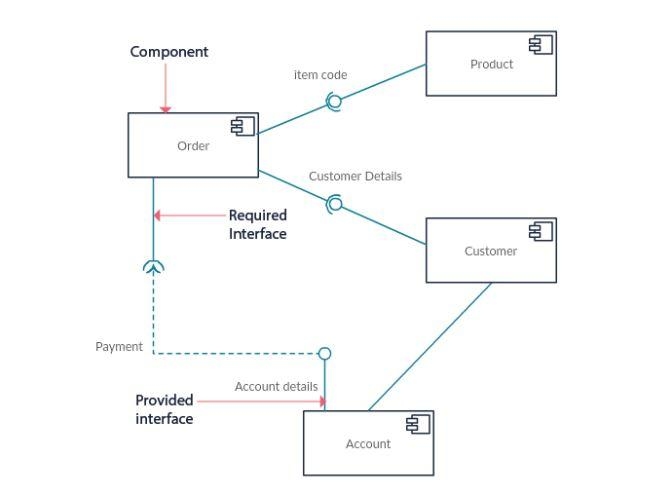
2. Component Diagram
This type of diagram is used in modeling the physical aspects of object-oriented systems. These systems are used for specifying, visualizing, and documenting component-based systems and also for developing executable systems through reverse and forward engineering.
Component diagrams are basically class diagrams that emphasize a system’s components. These components are often utilized to model the static implementation view of a system.
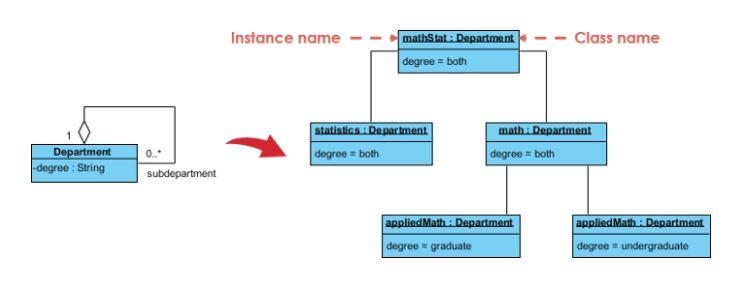
3. Object diagram
Object diagrams, sometimes identified as instance diagrams, are quite similar to class diagrams. Much like class diagrams, these types also highlight the connection between objects, but they use real-world examples.
These types of diagrams indicate how a system will look like at a given time. Since there is data available in the objects, they are used to simplify complex relationships between objects.
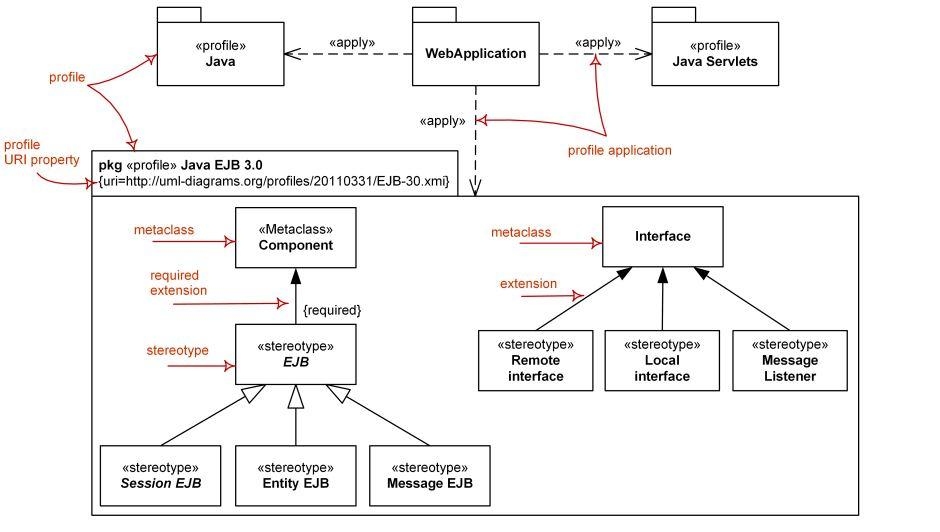
4. Profile diagram
A profile diagram is a kind of structural diagram in the Unified Modelling Language. It offers a generic extension mechanism for customizing UML models for specific domains and platforms.
Profiles are defined with the help of stereotypes, constraints, and tagged value definitions which are applicable to specific model elements, like classes, operations, attributes, and activities.
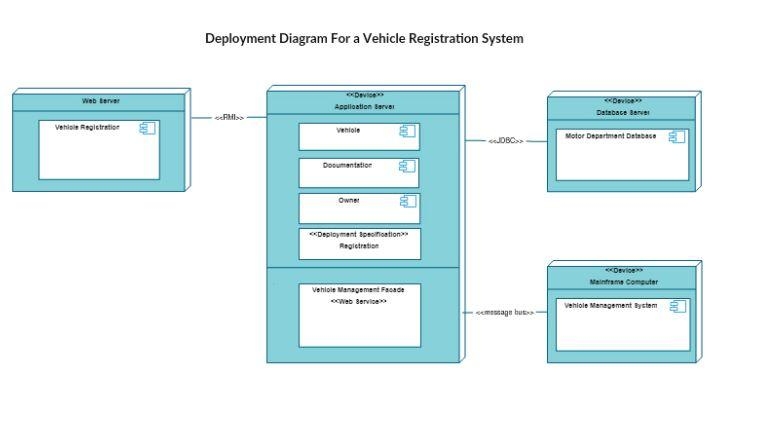
5. Deployment diagram
A deployment diagram is a kind that indicates the configuration of run-time processing nodes and the components that live on them. The deployment diagram is a kind of structure diagram applied in modeling the physical aspects of an object-oriented system. They’re frequently used in modeling the static deployment view of a system.
Deployment diagrams are essential, specifying, documenting, and visualizing embedded, client/server, and distributed systems. It’s also focused on managing executable systems through forward and reverse engineering.
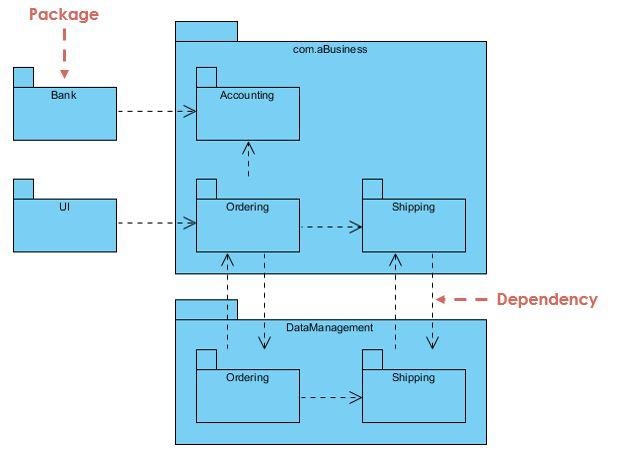
6. Package diagram
The package diagram indicates the organization and arrangement of model elements in the middle to large-scale project. This type of diagram can reveal both structure and dependencies between sub-systems or modules, indicating different views of a system.
The package diagram simplifies complex class diagrams. You can group classes into packages. A package is a collection of logically connected UML elements. Ultimately, a package can also be created by bringing together several other packages in order to define more complex systems.
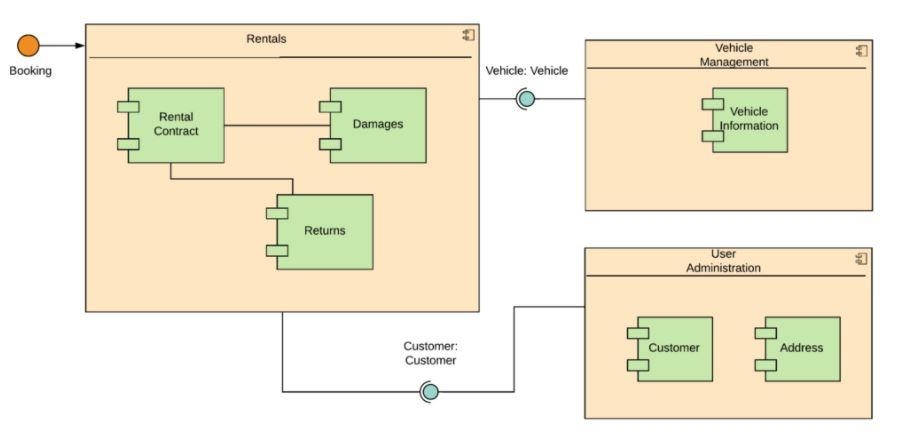
7. Composite Structure Diagram
The composite diagram is one of the newest addition to UML 2.0. A composite structure diagram consists of classes, packages, interfaces, and their relationships, and provides a logical view of all, or part of a software system. It reveals the internal structure (including connectors and parts) of a structured classifier or collaboration.
A composite structure diagram has a similar role to that of a class diagram, but lets you delve further into describing the internal structure of multiple classes and showing the interactions between them.
Behavioral UML diagram
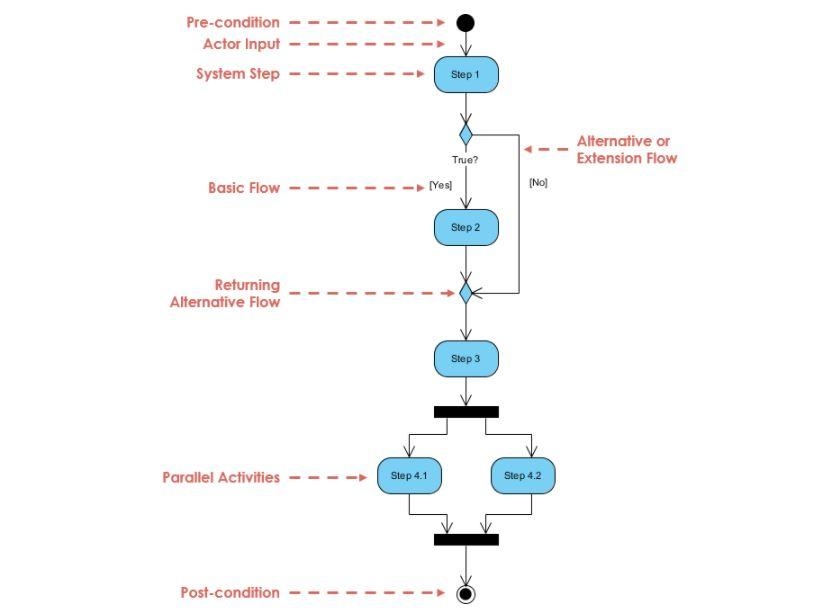
8. Activity diagram
Activity diagrams are possibly the most crucial UML diagrams for carrying out business process modeling. Software development, it’s generally used to define the flow of various activities and actions.
These can both be parallel and sequential. They emphasize the objects used, consumed, or produced by some activity and the association between the different activities. All these are essential in the case of business process modeling.
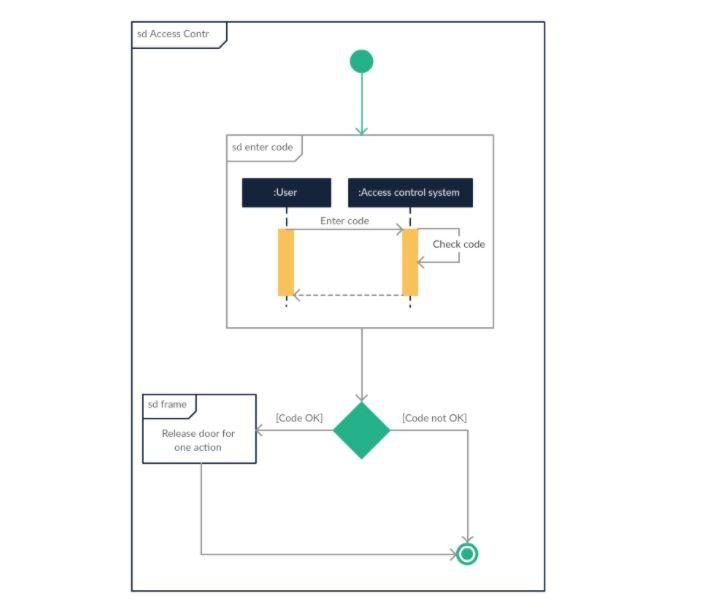
9. Interactive overview diagrams
It’s a variant of the activity diagram where the nodes are the interactions or interaction occurrences.
This type of diagram focuses on the overview of the flow of control of the interactions, which can also display the flow of activity between diagrams. In simpler terms, you can link up the “real” diagrams and achieve the ability to navigate between diagrams inside an interaction overview diagram.
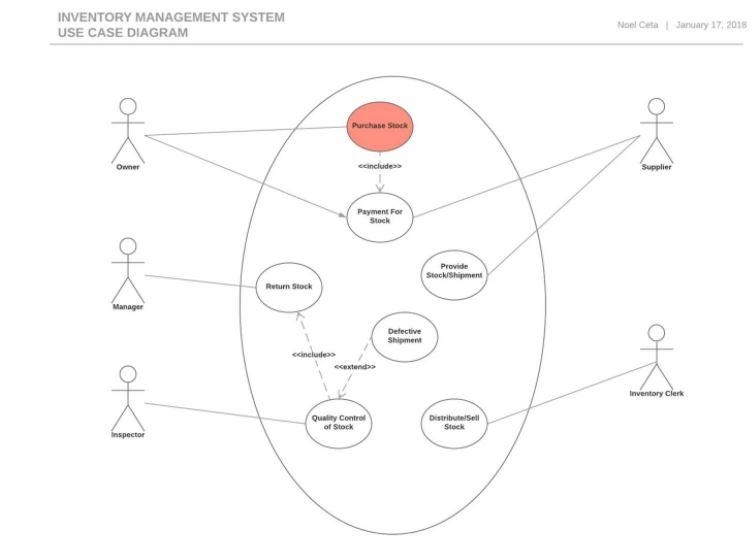
10. Use case diagrams
Use case diagram is the crucial form of system/software requirements for a new software program that’s underdeveloped. Use cases focus on the expected behavior, and not the exact method of making it happen.
Use cases, once specified, can be defined in both visual and textual representations (i.e. use case diagram). A major concept of use case modeling is that it assists in designing a system from the end user’s perspective.
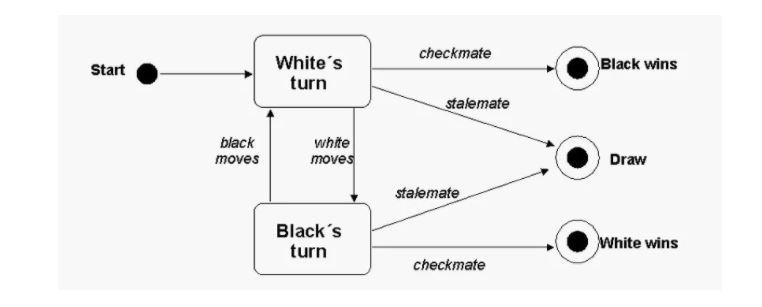
11. State diagram
State machine diagrams, also identified as state chart diagrams, are applied to define the different states of a component within a system.
A simple example of a state machine diagram would be a chess game. A typical chess game comprises moves made by White and by Black. White gets to have the first move and initiates the game. The conclusion of the game will happen regardless of whether it’s the White’s turn or the Black’s.
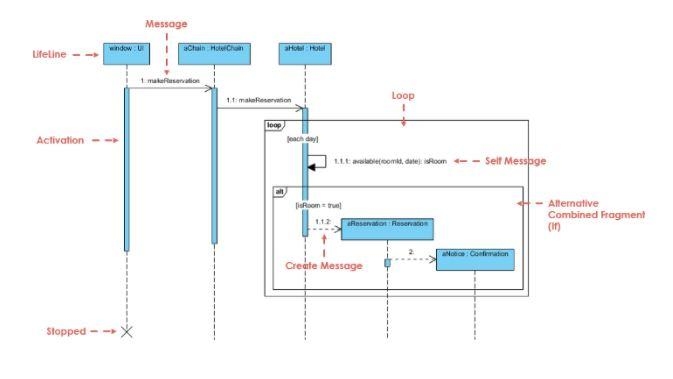
12. Sequence diagram
These types of diagrams are basically interaction diagrams that emphasize on how operations are carried out. They tap into the interaction between objects in the context of collaboration.
Sequence Diagrams are time-focused. They display the order of the interaction visually through the vertical axis of the diagram to keep track of what messages are sent and when.
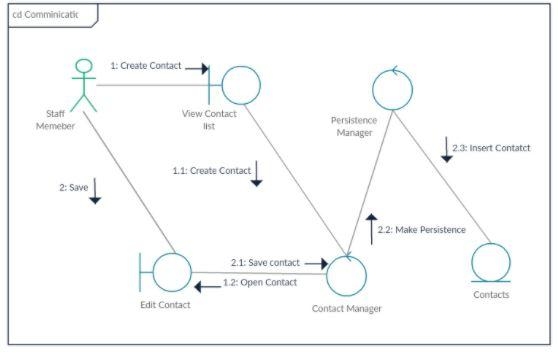
13. Communication diagram
This type is quite like the sequence diagrams — a type of interaction diagram that focuses on how objects interact. A communication diagram is also an extension of the object diagram that displays the objects along with the messages that travel from one to another.
Apart from the associations among objects, the communication diagram displays the messages the objects send each other.
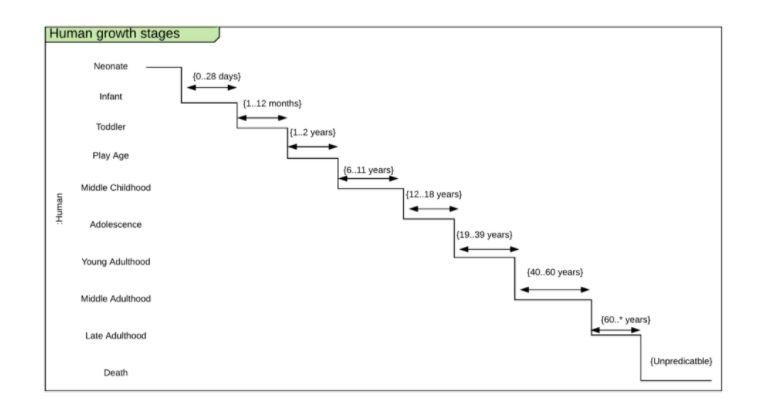
14. Timing diagram
Timing UML diagrams represent the relations of objects when the center of attention is focused on time. The emphasis isn’t on how the objects change or interact with each other, but instead on representing how objects and actors act along a linear time axis.
Each participant is represented through a lifeline, which is typically a line forming different steps since the individual participant moves from one stage to another.
Endnote
As you may have already understood, creating a UML diagram to document processes and systems can be beneficial. It allows you to discover flaws or possible optimizations that you possibly hadn’t thought of before. So, this post will give you clarity on creating these different diagrams while working on your UML assignment.
Author – Thomas Grant is a guest lecturer for a distinguished college in the UK. Thomas has acquired his MS degree in Engineering from Federation University. He has moderated many academic seminars and conventions in his career. He’s also an academic advisor for myasignmenthelp.com and provides UML or computer network assignment help services to students.